It's come up in conversation quite a few times now:
What goes on underneath the oceans surface that causes some places to attract swell in the way they do.
I have always thought that it would be interesting to have good quality bathymetry maps for my favourite spots. Does anyone know if there is a resource somewhere for this data?
Bathymetry maps...
Moderators: jimmy, collnarra, PeepeelaPew, Butts, beach_defender, Shari, Forum Moderators
-
oldo_nicho
- regular
- Posts: 114
- Joined: Wed Jun 09, 2004 2:26 pm
- Location: The wave of life man...

-
oldman

- Snowy McAllister
- Posts: 6886
- Joined: Tue Feb 10, 2004 1:11 pm
- Location: Probably Maroubra, goddammit!
It's a good idea Old-nicho. I know the sailors all have their bathymetry maps. Perhaps as they have been a source of income in the past (for someone) you might find that they aren't given out free on the web anywhere.
But I've often had the same thought. Funny really as the ocean topography is the other major factor in wave creation at the beach. Of course it will only really help for the rock shelves, bombies etc. The shifting sands on most beaches make it an impossible task to to keep track of.
But I've often had the same thought. Funny really as the ocean topography is the other major factor in wave creation at the beach. Of course it will only really help for the rock shelves, bombies etc. The shifting sands on most beaches make it an impossible task to to keep track of.

um dont think so, ive got these...SAsurfa wrote:You can order them from map shops and the like, but I don't think many areas are that detailed unless a bit of research and study has been done on the area.
But I love bathymerty maps, have ya got any for SA marcus?
APPROACHES TO NEWCASTLE
CAPE OTOWAY TO GABO ISLAND INC TAS
GABO ISLAND TO MONTAGU ISLAND
HOBART TO ST.HELENS PT
JERVIS BAY TO PORT JACKSON
LAKE MACQUARIE
MONTAGU IS TO JERVIS BAY
PORT STEPHENS
PORT STEPHENS TO CROWDY HEAD
SOUTH EAST CAPE TO CAPE PILLAR
they are all tiff images, i could probably re scan them as JPEG's when i get time, i have had trouble uploading them to photobucket in tiff format.
ill see what i can do, if your really desperate, i can email them.
-
oldo_nicho
- regular
- Posts: 114
- Joined: Wed Jun 09, 2004 2:26 pm
- Location: The wave of life man...
Marcus: I would be totally stoked with the map of Montague Is to Jervis Bay. A lot of spots in that stretch of coast! If you can't convert to .jpg then I could pm you my email for a .tif copy...
How come you have these charts anyway? Personal interest, or are they from work?
SAsurfa: It gets deep real quick off the south end of the Eyre Peninsula and the west coast of Kangaroo Is. What is the colour scale of the chart? Would be very interested to see charts of the West coast of Eyre Peninsula, particularly around a certain fishing town south of Streaky...
What work do you do that requires you to run bathymetry models?
oldman: I agree that at beachies the immediate bathymetry couldn't really be mapped because of the shifting sands, but at certain spots it would be interesting to see what is going on a fair way off shore to see if ridges or bommies are refracting the swell into a focal point, or breaking up a line of swell so that it doesn't hit a bit of coast so straight. For example, what goes on off the coast at Nuggans?!
-
macgreggor
- regular
- Posts: 186
- Joined: Wed Feb 18, 2004 10:13 pm
- Location: here and now
My work is for a large minerals and resources company and takes me to various drafting offices where sometimes i find goodies in the drawing cabinets.oldo_nicho wrote:Marcus: I would be totally stoked with the map of Montague Is to Jervis Bay. A lot of spots in that stretch of coast! If you can't convert to .jpg then I could pm you my email for a .tif copy...
How come you have these charts anyway? Personal interest, or are they from work?
I collect them for the purpose of finding secret bombies.
i have allready given a copy of some to 2nd reef and wanto.
The original copy of the jervis bay to montague island map was from a TAFE classroom that i pilfered. since then 'guard' used it and placed X's everywhere of places to explore, thats how we found a lot of reefs down there before the hordes, such as the now famous bombie and many many more reefs. I wont give you that copy, lol.
send me an email and ill send it off to ya.
cheers
-
moondoggie

- regular
- Posts: 222
- Joined: Tue Feb 17, 2004 12:17 pm
- Location: Manly
Boat Books North Sydney eh....
When I was involved with Freshie Reef all those moons ago - I got a copy of the Bathymetry of Freshwater from the Dive Shop in Manly.
These have since been mass marketed as keyring style plastic maps and still available there.
Anyone wanting a Bathymetry of their favourite spot just contact the local Dive school and get the next 'DiveMasters' Group to map it for you - they haave to produce a Bathymetry map as part of their qualification.
-
puurri
- Owl status
- Posts: 4832
- Joined: Sun Oct 09, 2005 11:56 am
- Location: Coogee Heights (estate agent speak)
My bit,
RAN hydropgraphic charts don't have the detail for close in coastal, more the general outline via contours that favour "safe navigation". However they do have stuff that is not in the public domain (for clearance divers/ secret squirrels etc) and detail stuff for offshore (magnetic anomalies/ wrecks etc) including seamounts. If you can plot how swell is channeled along underwater trenches then the latter is for you.
And that is why outside Voodoo etc gets mega on occasion.
"Notices to Mariners" may be the go.
Last edited by puurri on Wed Mar 12, 2008 9:59 pm, edited 1 time in total.

As was mentioned the Australian Hydrographic Service in the Gong are the national custodians of all hydrographic information. In theory anyone carrying out a hydrographic survey is meant to supply the raw data to the AHS for inclusion in the datasets they maintain.
The AHS produce a variety of paper and digital products available from the AHS or an agent. Boat Books is probably one of the biggest and best and also the Map and Chart shop in the west (Freo).
The products are focussed on Safe Navigation and so tend to be shipping/vessel centric rather than bathymetry centric.
Last I was aware the AHS was working on a "soundings" database into which they intended to load individual depth measurements. I think they intended to capture historiv info into this system. Most of this data is on plastic sheets! going back to Flinders.
This was intended for internal use mainly but the AHS has always been open to sharing the love if you have a legitimate reason for wanting the data and the money.
Other State dept's also produce a range of nautical charts which tend to be more detailed, such as WA DPI and QLD Dept. Transport. Again Boat Books and the Map and Chart Shop would be able to assist.
Other Gov. Departments also have info such at the old Auslig (cannot remember what they are called now).
-
puurri
- Owl status
- Posts: 4832
- Joined: Sun Oct 09, 2005 11:56 am
- Location: Coogee Heights (estate agent speak)
Last I was aware the AHS was working on a "soundings" database into which they intended to load individual depth measurements. I think they intended to capture historiv info into this system. Most of this data is on plastic sheets! going back to Flinders. This was intended for internal use mainly but the AHS has always been open to sharing the love if you have a legitimate reason for wanting the data and the money.mozzquito wrote:As was mentioned the Australian Hydrographic Service in the Gong are the national custodians of all hydrographic information. In theory anyone carrying out a hydrographic survey is meant to supply the raw data to the AHS for inclusion in the datasets they maintain.
The AHS produce a variety of paper and digital products available from the AHS or an agent. The products are focussed on Safe Navigation and so tend to be shipping/vessel centric rather than bathymetry centric.
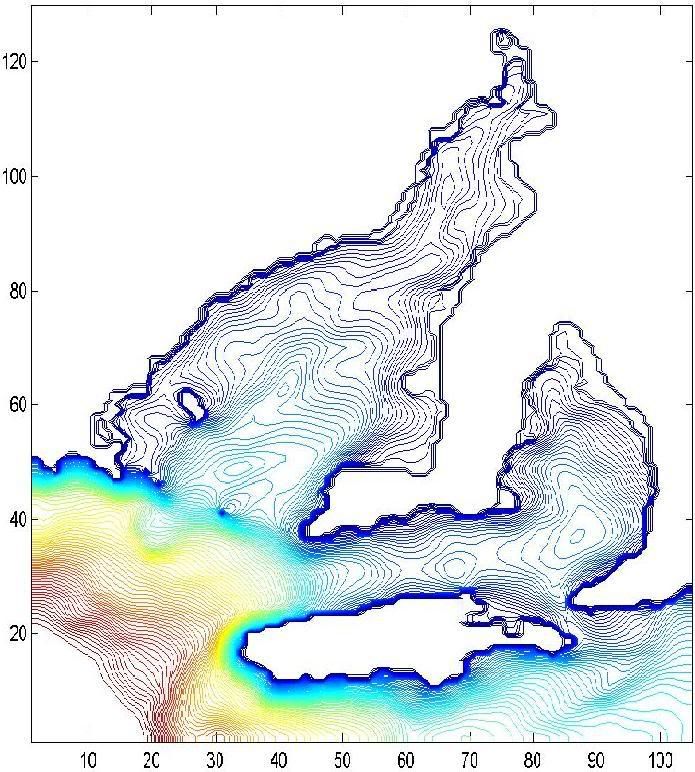
That diagram is using a scale where the bathymetry deepens by 1.5m for every contour, so the mazimum depth shown by the darkest red colour in the bottom left corner is 150m. I'm doing honours in Oceanogaphy and my project looks into modelling the effects of a de-sal plant at various locations within both gulfs, looking into the salinity change, the flushing time of the gulf and various other things like the circulation of the bottom, intermediate and surface water etc. It's a very interesting project and should be of use to quite a few people.oldo_nicho wrote: SAsurfa: It gets deep real quick off the south end of the Eyre Peninsula and the west coast of Kangaroo Is. What is the colour scale of the chart? Would be very interested to see charts of the West coast of Eyre Peninsula, particularly around a certain fishing town south of Streaky...
What work do you do that requires you to run bathymetry models?
Who is online
Users browsing this forum: No registered users and 117 guests