Page 1 of 1
Sydney's Big Blow
Posted: Tue Aug 03, 2010 4:28 am
by lessormore
It's been a while since we've had winds over a 100kph in Sydneytown. I wonder what the beaches will look like in the morning?
Update- Wattamolla just hit 113kph at 4.30am!
Re: Sydney's Big Blow
Posted: Tue Aug 03, 2010 8:10 am
by alakaboo
a tree squashed a car in our street.
looks like a student's car, hope they had insurance.
will post a pic later
Re: Sydney's Big Blow
Posted: Tue Aug 03, 2010 12:29 pm
by Donweather
What surprises me from the Sydney wave buoy is that for a Hmax of 11-12m, the Tpeak only came in at 11-12sec? I would have thought that a wave of 11-12m would have had a higher period than 11-12 seconds?
Re: Sydney's Big Blow
Posted: Tue Aug 03, 2010 12:37 pm
by marcus
i dunno don
the larger waves in southerlies on days like this and bigger seem to be short period, low power but high face, like really big slop
Re: Sydney's Big Blow
Posted: Tue Aug 03, 2010 1:23 pm
by SAsurfa
Donweather wrote:What surprises me from the Sydney wave buoy is that for a Hmax of 11-12m, the Tpeak only came in at 11-12sec? I would have thought that a wave of 11-12m would have had a higher period than 11-12 seconds?
Not when the swells generated so close to the Buoy picking up the observations.
There's no real time for the swell to draw out in period, and I thought 10-12seconds was pretty good for such a short-range swell.
Re: Sydney's Big Blow
Posted: Tue Aug 03, 2010 3:20 pm
by Donweather
I understand what you're saying Craig, but I just would have expected a 12m+ wave to have more energy (ie period). I'm trying (without great success) to find a plot Surfline produced sometime ago that had swell height versus swell period (energy) distribution and it showed what I'm trying to say. Without the chart, here's some rule of thumbs that I've found.
H1/10 Hmean Sig. Wave
Height Height Period Length
Metres Metres Seconds Metres
1.12 0.55 3.9 47
2.7 1.3 7.7 93
5.2 2.5 9.9 153
8.8 4.5 12.4 240
14.2 7 14.9 345
22.2 11 17.7 490
32 15.8 20.8 675
45 22.2 24 1060
H1/10 is the is the average height of the 10% of the highest waves, and roughly correlates with the max size of a wave group (set) that can be expected.
Hmean is the mean height of all the waves.
The period and wavelength are those for the significant wave (H1/3) which is the average height of the 1/3 highest waves.
The key thing to note from the above table is that for Hmax = 8.8m, and Hmean = 4.5, Tsig = 12.4sec and unfortunately it doesn't quote Tmax, but it would have to be larger than 12.4sec, hence my comment that Tmax for a Hmax of 12m+ should be greater than 10-12 sec.
Re: Sydney's Big Blow
Posted: Tue Aug 03, 2010 3:38 pm
by SAsurfa
Is this what you're looking for..
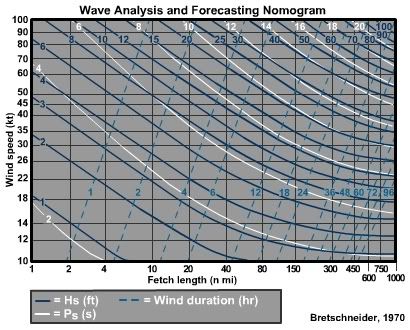
Don't have time atm to explain it but it's a rough guide for estimating wave heights, period etc
Re: Sydney's Big Blow
Posted: Tue Aug 03, 2010 3:45 pm
by Nick Carroll
donw the highest waves in any given storm are usually short period.
what a piece of shit this one is.
Re: Sydney's Big Blow
Posted: Tue Aug 03, 2010 3:52 pm
by alakaboo
donw, i don't have the length of observations, but i've done some rudimentary analysis of wave heights and periods for Sydney.
it's quite normal for the storm wind waves (locally generated) to have periods in the 8-9s range. I was actually surprised it got as high as it did.
Re: Sydney's Big Blow
Posted: Tue Aug 03, 2010 4:26 pm
by oldman
Too much knowledge here for me to enlighten you, but the storm was right on us. Readings for period in the midst of the maelstrom are a bit of a hoax, IMHO.
Re: Sydney's Big Blow
Posted: Tue Aug 03, 2010 8:48 pm
by Donweather
Ahhh, feck it, I'm not explaining myself very well and I've spent a fecking lot of time trying to find that wave energy versus wave height plot that I'm pretty sure was on an article on Surfline sometime ago, but I'll be fecked if I can find it now!!

Anyway, what I was trying to say is that wave height is directly proportional to wave period or wave energy. That is, the larger the wave height the larger the wave energy or wave period. So it's impossible to have a 12m wave at 6 sec period for instance. The Surfline chart explained this all very well.
Here's a similar chart (but it's not the one I was thinking of) that kinda goes the best way to explaining it.
- ocean09.gif (7.86 KiB) Viewed 6863 times
Notice that a 6.4m wave has a swell period of 13-15 seconds whilst a 3.2m wave has a swell period of 7-8 seconds. Note that this graph only applies to the wind fetch of the storm and not to wave heights and periods some distance away from the storm fetch.
Am I making any sense to anyone?
Re: Sydney's Big Blow
Posted: Wed Aug 04, 2010 7:59 am
by munch
Go the BEARS!
Re: Sydney's Big Blow
Posted: Wed Aug 04, 2010 9:23 am
by oldman
Donweather wrote:Ahhh, feck it, I'm not explaining myself very well
Nah, what you are saying makes sense, but wave height would have a range of possible wave periods.
11 or 12 metres at 10 or 11 seconds sounds hard to believe for sure.
Can you conflate the two though. i.e. is the max height and the period measuring for the same waves? I imagine not, in that the max height may have no period measured at all (rogue loner wave) while period measures may have been from more developed trains which may have been for 3 - 4 metre waves?
Just asking.
Re: Sydney's Big Blow
Posted: Wed Aug 04, 2010 9:24 am
by alakaboo
don, everything you're saying makes sense.
here are my non-oceanographer, non-forecaster thoughts...
there are natural limits to how steep an ocean (deep water) wave can be, due to the gravitational forces acting on the water and the natural cohesive effect. Kind of akin to the angle of repose of materials such as sand, you can push as much as you want on the pile, it won't stay steeper but will collapse.
hence, as you said, it is impossible to have a 15m wave with 4s period, etc. the period will fall somewhere within a range that is proportional to the wave height. (because higher peaks have longer tails/slopes, hence longer periods)
with these observations, a couple of other things come to mind:
the wind was strong close to the point of measurement of the waves. i wasn't looking at the maps at all, and i don't know the exact location of the Sydney buoy at the moment, but the waves wouldn't have had time to decay or organise themselves into trains much at all.
the wind was also fairly gusty, hence irregular seas.
in fact, given the reported periods are max and average, it's possible there were a lot of 'double-ups', where two trains combine to give 'swells' twice as high as 'seas', but with short periods
any more learned ideas?
Re: Sydney's Big Blow
Posted: Wed Aug 04, 2010 11:00 am
by alakaboo
had another idea, which could be completely irrational...
the directional waverider buoys have 3 accelerometers, measuring movement in the X, Y and Z directions.
Assume vertical displacement is Z, and is the wave height measurement.
The buoys are in about 80m of water, and have a bit of play in the anchor chain to allow for large swells, and also boat strikes.
in large, disorganised seas, where the whitecaps are rolling (not sure about wind strength/beaufort etc), I'd imagine that the buoy could be knocked onto it's side and pushed along a bit. Hence, the wave 'height' measured could actually be the horizontal displacement. (in the z direction, as it is relative to the orientation of the buoy, not the 'real' up and down)
righto, my morning coffee has worn off, so i'll leave that one with you...